Pathways International Data Analytics Program
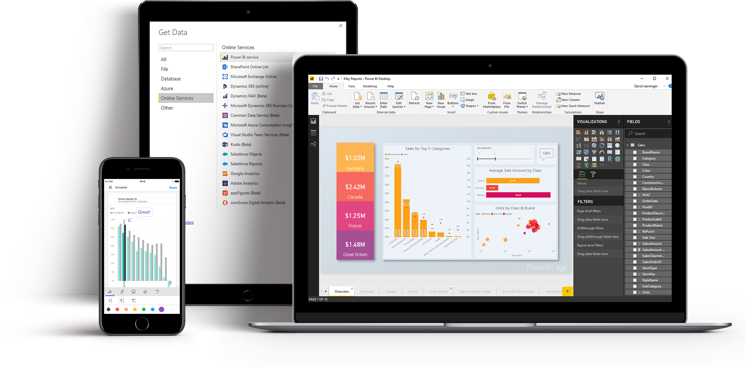
Discover the power of Data Analytics through industry-leading technology such as Microsoft SQL, Power BI & Python.
Developed by Pathways International

About The Program
The demand for data analyst skills has increased significantly in the last 5 years. Pathways Data Analytics program can help accelerate your career in data in as little as 12 weeks. Pathways Data Analytics program is beginner-friendly with no prerequisites to begin our course. Pathways Data Analytics program was built by veterans in the industry, who know exactly what is needed to help individuals succeed in a career in data.
Pathways Data Analytics program will teach you to harness Excel, SQL, & Power BI to drive powerful analysis and insights. Pathways curriculum gives you everything you need in 12 weeks to present an employer with an impressive portfolio.
Our program will help build your confidence and credibility by applying this versatile skill set to jobs spanning several industries. This course is beginner level and will ultimately prepare you for junior data analyst roles.
Our industry-aligned curriculum prepares you to:
- Manage the entire data analytics workflow.
- Acquire, analyze, and visualize data sets in real time.
- Master industry-standard tools like SQL, Excel, Power BI, and Python.
- Turn data into stories that can influence and inform important decision makers.
- Ask the right questions and answer them with data-informed insights.
- Demonstrate what you’ve learned with a solid professional portfolio.
Register Today!
Our students gain a thorough understanding of critical data analytics and data science technologies. The course covers SQL, Power BI and Python and gives graduates the skills needed to market themselves as data analytics professionals.
To register or for more information email us by clicking the button below.
Online Classroom
Experience the best of online education with our innovative team. We seamlessly blend instruction, technology, and collaboration into a proven approach to career transformation, preparing students to succeed on the job.
- Learn from our top instructors
- Get online, individualized training from local pros who are available to offer hands-on support and lead discussion.
- Collaborate and connect with a network of peers with diverse professional backgrounds.
Course Syllabus
Become an effective inspector, critically scrutinizing datasets for veracity and quality before deciding to use them. You’ll understand how to identify reliable data sources, data storytelling, algorithmic bias, and data ethics.
- Identify the possible limitations and quality issues associated with unfamiliar datasets including missing data or unreliable sources.
- Understand the bias that is being introduced into predictive models through training data, choice of model, or evaluation metric.
- Explain the ethical and regulatory issues associated with data acquisition methods.
- Apply a checklist to assess whether the data are likely to be accurate and reliable.
- Qualify issues in a data set and diagnose the type of missing data.
- Apply ethical scraping principles to a given scenario.
Jump into the fundamental statistical and mathematical techniques required for data analytics. Understand descriptive statistics, dependent and independent variables, types of missing data, linear regression, and model validation.
- Identify the difference between key descriptive statistics, including the median and mean.
- Given a scenario, determine whether a simple or complex model should be used.
- Apply the principles of linear regression, including minimizing the sum of squared residuals, and using RMSE as a performance metric.
- Compute appropriate statistics using a variety of tools, including SQL, Excel, Tableau or Python.
- Choose an appropriate model to solve a given problem; justify the choice of the model used and identify the independent variables.
Develop your SQL skills. You’ll complete this unit with an understanding of the benefits of using specialized tools such as SQL for specific stages of the data analytics workflow, over multi-purpose tools such as Excel.
- Know the difference between relational and non-relational databases, and identify the advantages and disadvantages of relational and non-relational databases.
- Apply knowledge of Boolean logic when filtering datasets and SQL syntax and debug queries that produce error messages.
- Apply algorithmic thinking skills to a series of SQL queries given an analytical question.
- Interpret the results and indicate the limitations of the data given a query.
Explore and analyze datasets using Excel. Learn to write formulas to perform more complex analyses, build visualizations using lookups to efficiently search datasets and pivot tables.
- Apply syntax and commonly used commands for cleaning, transforming and analyzing data.
- Justify the choice of analysis, given a scenario, and select the appropriate calculations to perform for a given task.
- Select the most appropriate visualizations to effectively communicate results.
- Given a scenario, identify the correct order of steps of the analytics workflow to plan and implement a full data analysis.
- Determine whether an unfamiliar dataset requires extensive cleaning or manipulation.
Analyze and visualize data using the dashboarding and business intelligence tools such as Power BI. Effective visualization and communication with storytelling will be the heart and soul of this unit.
- Tackle every stage of the data analytics workflow, including handling very large datasets.
- Identify and apply data visualization tools that can interface with a range of data sources.
- Determine whether exploratory data analysis is required as a precursor to predictive modeling tasks, given a scenario.
- Demonstrate the principles of good data dashboard design.
Now is the point to enhance your growing skills in data acquisition, analysis, and visualization using Python programming fundamentals, data acquisition with APIs, exploratory data analysis, and simple linear regression.
- Identify the algorithmic thinking skills that are required to break complex questions into smaller steps.
- Indicate how Jupyter Notebook is a useful development environment for data analytics.
- Identify the information that can be gained from Matplotlib, seaborn, or Plotly.
- Determine the significance of certain metrics when performing exploratory data analyses in Pandas.
Learn the skills you need to work in an organization, as part of a team of data professionals and nontechnical colleagues. The importance of adhering to regulations, data privacy, and security, will also be emphasized.
- Identify landmark legislation around data governance and privacy, including GDPR and how it applies to roles in an organization.
- Identify the differences between commonly used agile working frameworks, including scrum and kanban.
- Give a technical presentation in which information is presented concisely for a non-technical audience.
- Deploy a Python script on a cloud service to demonstrate that continuous monitoring and analysis is possible.
To round out your education, you will apply rigorous data analysis techniques to solve a problem in two projects: a group project and an individual project. Both will require you to collect, clean, and analyze a data set and create a compelling presentation to share your or your team’s insights.
In this unit, we educate our students on how to take what they have learned from the immersive and pivot themselves into a new career. We do this by encouraging them to get involved locally with meetups and other social groups pertaining to data analytics. We teach you how to format your resume so that you can present your abilities and skillset to your employer in a professional manner. We provide coaching on how to handle the interview process.
Portfolio
- Each student will graduate with a portfolio containing the projects they worked on during the course to showcase to future employers. By completing the class assignments and projects, each student will graduate with a portfolio of projects that they can showcase to future employers.
Career Services
- Resume' Services
- Career Coach: Will help you understand your local job market, find opportunities, and connect with the local data community.
- Job Seeking Planner
- Portfolio Deployment
Certificate of Completion
- Upon completion of Pathways Data Analytics Immersive, each student will receive a certificate of completion.